First graders have taken a strong liking to our iPad’s at school and are strong creators and bloggers with an iPad as a tool. Typically, iPad’s are consuming devices at this age, however I wanted to share a basic math lesson over the course of three days, that touches on the Massachusetts Math Frameworks, incorporating both iPads and Google Docs. The Google Docs side of this lesson is exciting because of the ease of which a teacher is able to create and share. The teacher will need either a personal Gmail account or Google Apps for Education account to create a Form, Document and a Presentation.
Quick notes for the teacher: Before the lesson, iPads can be prepped using various apps and you could even use your school faculty page or classroom website to post the shared links that students will need to use. There isn’t a need for each student to have his/her own account. Goo.gl is excellent at shortening Google Doc links as well.
Day One: Gather
During the first of three 30-minute sessions, place students in groups of 4-5 and collect three data points from five of their friends using a simple Google Form.
Form Link:
https://docs.google.com/forms/d/13LXY3iEs_WDQ1qG0W3STvahjE5Q7ZffedEzkM7nml8w/viewform
Response Spreadsheet Link:
https://docs.google.com/spreadsheet/ccc?key=0AphYziSSemcEdGRVV2QzQkQ0WFJQNmV1U2NraERoT3c&usp=sharing
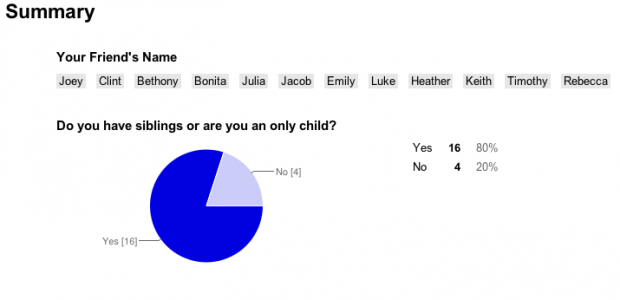
Response Graph Link:
https://docs.google.com/forms/d/13LXY3iEs_WDQ1qG0W3STvahjE5Q7ZffedEzkM7nml8w/viewanalytics
Three Questions to ask:
1.) Do you have siblings or are you an only child?
2.) Do you have a pet at home or not?
3.) Given the choice between ice cream and cookies for dessert, which would you choose?
After collecting all data points today on our classroom iPads and learning about our friends’ likes and dislikes, explain that tomorrow we will analyze the data.
Day Two: Analyze
Review the assignment from the previous day. Ask students to share their predictions about what they think the data will show. In small groups, work with students to classify the data into categories. Share with them the Google spreadsheet and the response graphs as well as use the Google Presentation. Facilitate a discussion based on what they notice about the data. Be clear that both the spreadsheet and the graphs are representing the same data (one in a visual way, and one in a text based way). The goal is that they understand that data can be presented in many ways. Encourage students to share their thoughts and questions as you lead this discussion. By the end of the small group time, work with the students to count the number of responses in each category.
Google Presentation:
https://docs.google.com/presentation/d/1TCLo0JcE85Nz-D7DJERwDNBR4kdm4A8yFnI0_VtHWVQ/edit?usp=sharing
Day Three: Respond
By the third day, students should be comfortable with the information that they gained from participating in this activity. Begin day three by recapping the events of days one and two. Review the number of responses in each category and begin to have students use math vocabulary to explain the data. For example: ‘two more people like cookies than ice cream’ or ‘most people in our class have a pet’ or ‘no one is an only child’. Post math vocabulary: more, less, least, most, equal, data, etc… on the class whiteboard or word wall.
As students talk about the data, require that they use this math vocabulary in their responses. Once all students have had a chance to talk and share their thoughts, explain that they will be working on putting their thoughts into words by completing a short assessment using Google Forms or in this case, I created a response sheet, which when copied over to an app, will allow students to draw with the iPad using an app like Skitch or Penultimate and to answer the questions directly in the iPad.
Paper Response:
https://docs.google.com/document/d/1iN7SOeuULOyIbgyvRGRTgR3B4LyTL4OGrUxD1Sjl6Sw/edit?usp=sharing
Direct students to write a sentence for each data point collected. Refer them to the whiteboard/word wall for important math vocabulary. After they have written at least one sentence for each data point, they may draw a picture to match.
Thoughts?
Massachusetts Curriculum Framework for Math: Grade One Measurement and Data 1.MD
Represent and interpret data:
4. Organize, represent, and interpret data with up to three categories; ask and answer questions about the total number of data points, how many in each category, and how many more or less are in one category than in another.